
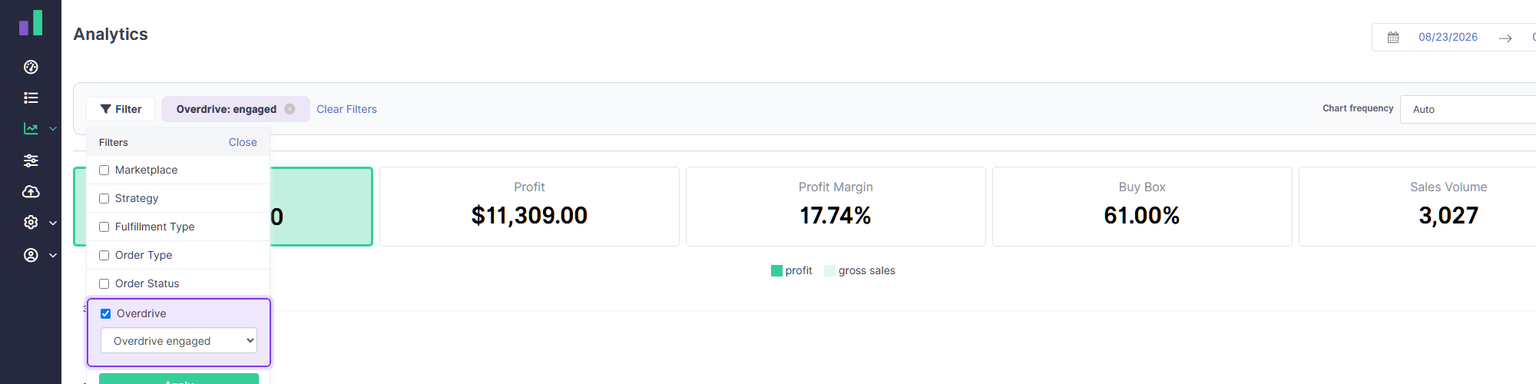
Overdrive helps your most competitive listings respond faster when competition changes. Now you have more ways to see how that faster repricing is performing, whether you want to explore the bigger picture or take a closer look at an individual listing.
New Analytics filters and the Overdrive Performance by Listing report make it easier to compare results with and without Overdrive.
Explore performance in Analytics
Head to Analytics and filter by Overdrive selection to explore sales, Buy Box, profit, and margin. Choose the date range you want to review, then switch the filter to see results with or without Overdrive. Clear the filter whenever you want to return to your overall view.
Use these filters to see how your Overdrive-selected listings are performing across the metrics that matter to your business. For example, you can look at Buy Box percentage alongside profit and margin to get a more complete picture than sales alone.
Compare performance by listing
The new Overdrive Performance by Listing report shows each listing's metrics three ways: total, with Overdrive, and without Overdrive. Find it on the Reports page, or access it through the Reporting API and Informed Repricer MCP.
Use the report to compare results at the listing level and see where Overdrive is making a difference. With API and MCP access, you can also bring those metrics into your integrations and AI-powered workflows for deeper analysis using the tools you already rely on.
Learn more about Overdrive and how to select listings for faster repricing.