
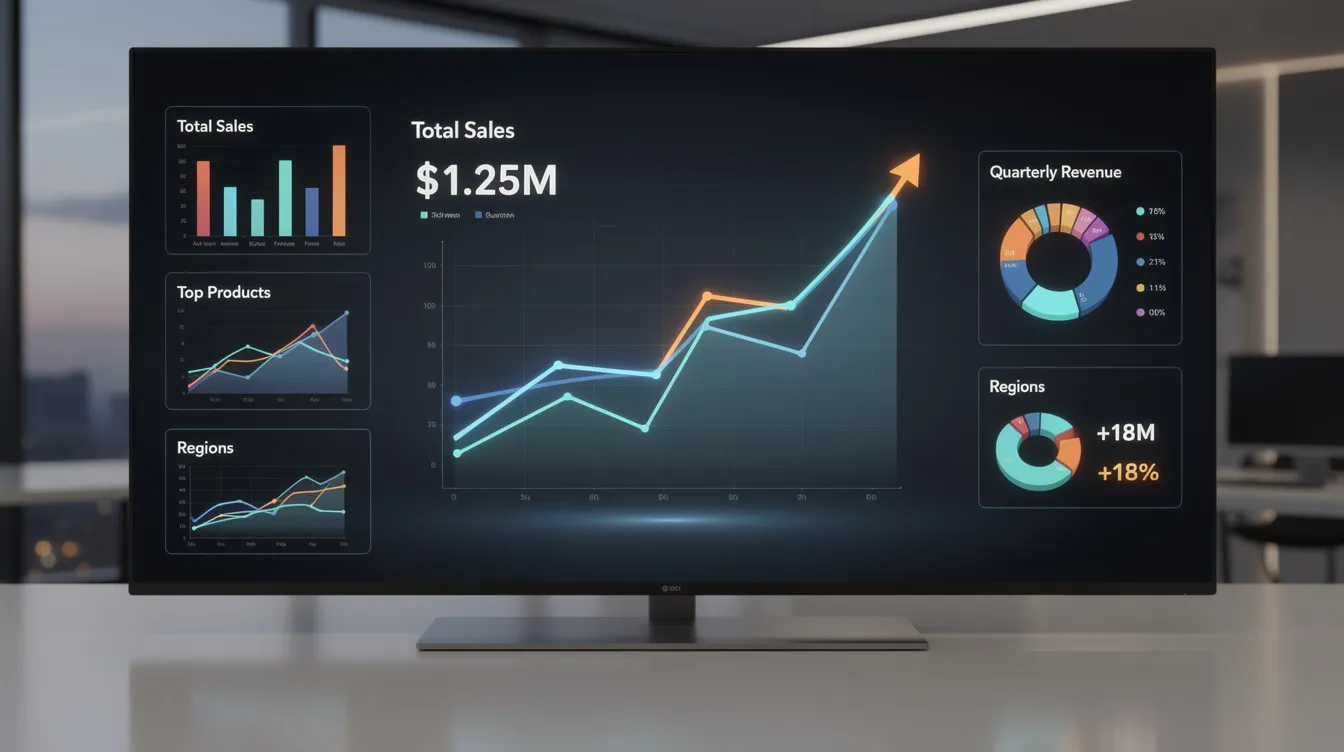

Introduction to Amazon Sales Data
Amazon sales data encompasses everything measurable about what sells on the platform: orders, revenue, sales volume, conversion rates, and ranking signals. For amazon sellers and brands competing across one of the world's largest marketplaces, this data is the foundation of every profitable decision.
How many sales can you expect on Amazon? The honest answer: it depends entirely on your product category, Best Sellers Rank, price point, and historical sales data. A desk lamp ranked in the top 5,000 in Home & Kitchen might move dozens of units daily, while the same BSR in a smaller category could mean just a handful.
Amazon's global marketplace GMV exceeded $830 billion in 2025, and Amazon's revenue increased by 13.8% to $717 billion that same year. With active third-party sellers worldwide reaching around 1.9 million in 2025, understanding your slice of this market is non-negotiable. Businesses can analyze Amazon sales data using native tools and external platforms.
Key benefits of tracking sales data:
-
Monitor net profit margins after Amazon fees and fulfillment costs
-
Plan inventory to avoid stockouts and overstock situations
-
Measure advertising ROI and optimize ad spend
-
Identify patterns in traffic, conversion, and revenue across individual products
Core Concepts: Sales Volume, Monthly Sales, and Amazon Revenue
Before diving into reports and tools, get clear on the metrics that matter:
-
Sales volume refers to the count of units sold over a given period. This is your units ordered number, and it drives inventory planning, capacity decisions, and fulfillment logistics.
-
Monthly sales reduces that volume to a monthly timeframe, expressed in both units sold per month and revenue (units × item price).
-
Amazon revenue comes in two flavors: gross revenue (item price × units) and net revenue after subtracting referral fees, FBA fees, storage, and returns.
For example, if a product sells 1,000 units per month at a $25 price, gross revenue is $25,000. After Amazon fees (typically 30–40%), net revenue drops to roughly $15,000–$17,500. This distinction matters because Amazon's net profit reached $77.6 billion in 2025, but individual sellers must track their own margins carefully.
Third-party sellers accounted for $575 billion of Amazon's GMV in 2025, and third-party merchants account for roughly 61% to 62% of all paid units sold on Amazon. Here's how units vs revenue serve different purposes:
-
Units → inventory planning, warehouse capacity, reorder timing
-
Revenue → financial planning, margin calculations, cash flow management
-
Both together → setting business goals like hitting $50K/month or achieving 20% net margin
Where to Find Your Own Amazon Sales Data in Seller Central
Your seller central account holds first-party sales performance data that no external tool can replicate. Here's where to find it:
-
Navigate to Reports → Business Reports inside Seller Central.
-
Open the Sales Dashboard for an account-wide view of units ordered, ordered product sales, and recent trends.
-
Select Sales & Traffic by Date for aggregate daily, weekly, or monthly totals including sessions, page views, and conversion metrics.
-
Use Detail Page Sales and Traffic by ASIN to break down performance per product - sessions, unit session percentage, Buy Box %, and revenue.
Core metrics in these business reports include:
-
Units ordered - total units customers purchased
-
Ordered product sales - revenue tied to those units (excluding shipping/taxes)
-
Sessions and page views - traffic signals; sessions count unique visitors
-
Unit session percentage - your conversion rate proxy
-
Buy Box percentage - how often your offer appears in the Buy Box
You can set custom date ranges (last 7 days, 30 days, full quarters) to analyze sales history and seasonal patterns. Export any report as a csv file for detailed analysis in Excel, Google Sheets, or BI tools. Amazon Brand Analytics provides insights into search terms and customer behaviors, adding another layer of detailed information.

Estimating Amazon Sales for Products You Don't Own
Amazon doesn't publish exact product-level sales data publicly. To estimate sales for competitors or new products you're researching, you'll rely on proxies and estimation methods:
-
BSR + Category benchmarks: Best Sellers Rank is your strongest proxy. A BSR of 5,000 in Electronics might mean 20–100 units per day; the same rank in a smaller product category could mean far less. Published BSR-to-units curves use log-based models to generate ballpark monthly sales estimates.
-
Review count and recency: A study of ~19,000 SKUs found that products with 100–200 reviews see roughly 320% higher sales vs products with zero reviews, and 500+ reviews correlate with 850%+ lift. Reviews build customer trust and directly influence how many products sell.
-
"Bought in past month" labels: Some listings display recent buyer activity. These are useful directional signals, though not available for all products.
-
Third-party sales estimators: Sales estimators analyze product rankings and past sales data to generate estimates. Helium 10's estimator predicts sales based on BSR and price, making it a go-to for quick competitive research.
Combine category context with BSR data to get the most reliable sales estimates. Adjust upward during Prime Day or holiday seasons and downward during slow periods.
Using Third-Party Tools to Analyze Amazon Sales Data
When Seller Central data isn't available (because you don't own the ASIN), specialized analytics tools fill the gap:
-
Jungle Scout offers a popular sales estimator. For example, Jungle Scout estimates 11,640 sales per month for a product in a competitive category - useful for sizing market demand before you launch a new product.
-
AMZScout's calculator provides monthly sales estimates for products using BSR and category inputs, and includes a Chrome extension for on-page data overlays.
-
Amazon's Revenue Calculator helps estimate FBA costs and profits, so you can model margins before committing inventory.
Typical features across these tools include:
-
Chrome extensions that overlay sales estimates, price history, and competition data while you browse Amazon
-
Historical BSR graphs showing sales trends over weeks or months
-
Market-level dashboards with niche opportunity scores and demand distribution
-
Bulk ASIN tracking to monitor top products across different searches and amazon categories
-
Keyword search volume data to explore demand signals
Tools using 2024–2026 marketplace data now track BSR fluctuations across 21 global marketplaces, letting sellers compare region-by-region performance. The limitation: all estimates are directional. BSR is volatile, influenced by promotions, stockouts, and temporary discount events. Use multiple sources and average the results.
Analyzing Sales History and Seasonality
Sales history means tracking how your units and revenue change over time - months or years - to reveal sales trends, product life stages, and cyclical patterns. A product in its growth phase looks very different from one in decline.
To build and read a trend chart:
-
Plot monthly units sold (or revenue) from Jan 2023 through mid-2026 as a line chart
-
Overlay year-over-year comparisons for the same months to identify patterns in seasonality
-
Add a 3-month or 12-month moving average to smooth noise from one-off spikes or supply disruptions
Seasonal peaks to watch for:
-
Q4 holidays (November–December): the biggest revenue period for most e commerce sellers
-
Back-to-school (late July–August): strong for office, electronics, and apparel
-
Prime Day (typically July): a massive traffic and conversion spike
-
Black Friday / Cyber Monday: increasingly important even for Amazon-native brands
Use these visualizations to plan inventory, set ad budgets, and time new products launches to coincide with demand spikes rather than fighting against slow seasons.
Prime Day and Other Sales Events in Your Data
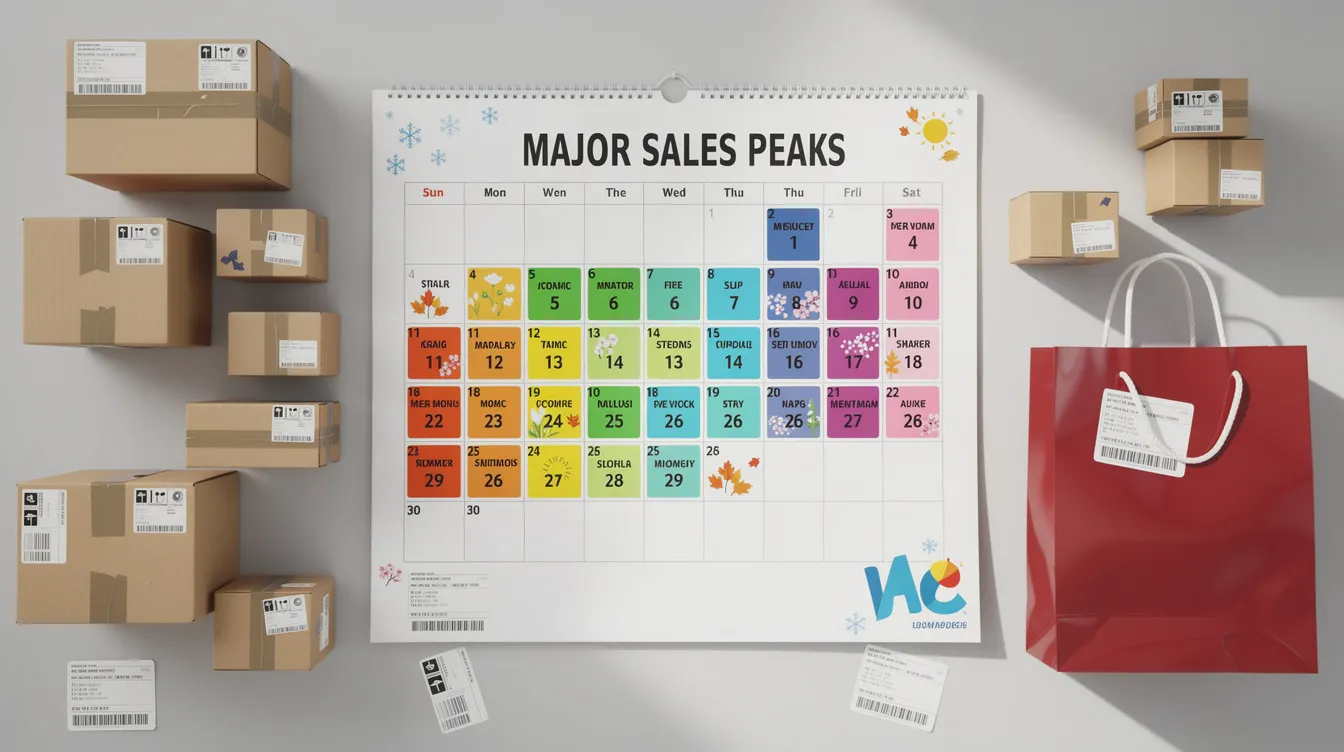
Major events show up in your amazon sales data as unmistakable spikes. In your sales dashboard, you'll see sharp increases in sessions, conversion rates, and units ordered during event windows.
The scale is significant: Amazon Prime Day sales reached $24.1 billion in 2025 during a four-day event (July 8–11), a 30.3% increase over the prior year. In 2025, U.S. online Black Friday sales reached approximately $11.8 billion, making it another critical data point in your sales history.
How to segment reports around events:
-
Extract business reports for event week vs. baseline period (the week before, or the same week last year)
-
Measure uplift in three dimensions: sessions (traffic), unit session percentage (conversion), and ordered product sales (revenue)
-
Calculate whether the discount you offered still delivered acceptable margins after the boost in volume
Planning tips for future events:
-
Stock up on inventory 4–6 weeks before expected spikes
-
Ramp up ad spend the week prior to build momentum and capture early deals traffic
-
After the event, review what sold well and what didn't - use insights to plan for the next one
-
Track whether event customers leave reviews, boosting long-term sales performance
Breaking Down Sales Data by Category, ASIN, and Region
Different amazon categories have wildly different dynamics. Electronics is high-competition with large average order values. Beauty sees repeat purchases but slower review accumulation. Home & Kitchen sits somewhere in between. Understanding your product category context is essential for realistic benchmarking.
At the ASIN level, use "Detail Page Sales & Traffic by Child Item" to find which SKUs drive the most amazon revenue - and which drag performance down. Sometimes a single color or size variant underperforms, pulling down the parent listing's conversion rate and Buy Box percentage.
Geographic segmentation matters too. Q2 2026 net sales totaled $200.6 billion, a 20% increase year-over-year. North America segment sales rose 16% year-over-year in Q2 2026 to $116.2 billion, while international segment net sales grew 15% year-over-year in Q2 2026 to $42.2 billion.
Here's an example of how a brand like Samsung or a mid-size seller might break down their dataset:
| Category | Region | % Revenue | Units Sold/Month | YoY Growth |
|---|---|---|---|---|
| Home & Kitchen | US | 60% | 2,000 | +25% |
| Home & Kitchen | UK | 20% | 700 | +15% |
| Beauty | US | 15% | 1,200 | +10% |
| Electronics | DE | 5% | 300 | +30% |
| This kind of breakdown helps you find products with expansion potential, identify where to allocate ad spend by region, and decide whether entering new marketplaces is worth the cost. |
Turning Sales Data into Growth Opportunities and Business Goals
Raw data means nothing without action. Here's how to connect your metrics to strategic growth opportunities:
-
Falling conversion on mobile? → Improve image quality, optimize A+ Content for mobile screens, and test your store layout on smaller devices.
-
Traffic growing but sales flat? → Your listing content or price likely needs work. Test price optimization or update bullet points and product name details.
-
Low Buy Box percentage? → Consider FBA enrollment for faster shipping, or review your pricing strategies against competition.
-
High-traffic keywords with low conversion? → Your listing may not match customer intent for those different searches. Adjust copy or consider launching complementary new products.
Amazon's advertising business is growing faster than its underlying retail business. Advertising revenue increased by 26% year-over-year in Q2 2026 to $19.8 billion, while operating income in Q2 2026 increased by 43% to $27.5 billion. Amazon projected approximately $220 billion in capital expenditures for 2026. These numbers tell you Amazon is investing heavily in its ads ecosystem - which means sellers who master ad-driven growth will have an advantage.
Concrete tactics driven by data: bundling to raise average order value, using historical performance to time promotions, and running detailed analysis on which ASINs respond best to ad spend to boost overall success.
Common Questions About Amazon Sales Data
-
How many sales does a given BSR represent? It varies by category. BSR 5,000 in Electronics might mean 20–100 units per day; in a smaller category, it could be just a handful. Always use category-specific benchmarks.
-
How accurate are sales estimators? Directional, not exact. Most estimates are off by 20–50% depending on assumptions about category size, promotions, and demand. Use multiple tools and average results.
-
Can non-sellers see Amazon sales data? No. Proprietary data like units sold, revenue, and traffic is only available through a seller central account. Public signals are limited to BSR, reviews, and badges.
-
How far back does sales history go? Most Business Reports retain up to ~2 years of historical data. Daily granularity is typically available for 60–90 days.
-
Why doesn't Amazon publish competitor sales? Data privacy. Revealing exact competitor-level units and revenue would expose competitive intelligence. Amazon protects this across all segments - retail, video streaming, and even AWS. Speaking of which, Amazon Web Services reported $42.2 billion in Q2 2026 sales, a 37% year-over-year growth rate, and AWS's backlog rose to $496 billion, indicating future demand. Meanwhile, Amazon generated negative $7.6 billion in free cash flow over the trailing twelve months, showing how capital-intensive the business remains.
Practical Workflow for Ongoing Amazon Sales Analysis
Consistency beats intensity. Here's a recurring workflow to keep your analysis actionable:
Weekly:
-
Check the sales dashboard for drops in sessions, conversion, or Buy Box share
-
Monitor your top 10 ASINs by units and revenue; flag any that are declining
-
Review ad spend vs. incremental revenue on active campaigns
Monthly:
-
Deep dive into ASIN-level sales history; compare month-over-month trends
-
Isolate effects of any price changes, promotions, or listing updates on sales volume
-
Track review growth and its correlation with conversion
Quarterly:
-
Strategic review against business goals - revenue targets, margin objectives, SKU rationalization
-
Evaluate whether to expand into new amazon categories or marketplaces
-
Assess inventory turnover: units held vs. units sold to optimize cash flow
Build a simple tracking template where you log per SKU: monthly sales, revenue, ad spend, net profit, reviews count, Buy Box %, and conversion rate. Include columns for seasonal adjustments (Prime Day uplift, holiday spikes) and date-stamped notes on what changed.
Amazon sales data is only as valuable as the actions you take on it. Start with your own Seller Central reports this week, layer in external estimates for competitive insights, and build a routine that turns raw numbers into measurable revenue growth.